09-prometheus
容器化领域后面进阶的几个方向

- 日志处理  EFK架构
- 监控 、普罗米修斯
- cicd、jenkins
- 微服务架构
想在k8s里部署普罗米修斯,还得对k8s基础组件,RBAC、节点亲和性等有一定学习。
以及学习普罗米修斯的整体组件、架构。
1.prometheus介绍
https://github.com/prometheus/prometheus 基于go语言开发
2.监控k8s的需要部署的组件
1. metric-server是k8s收集资源指标的组件、kubectl、hpa、scheduler都可以直接获取metrics api接口数据
https://github.com/kubernetes-sigs/metrics-server


2. prometheus-operatoer
https://github.com/prometheus-operator/prometheus-operator
用于部署普罗米修斯以及相关的监控组件,通过k8s原生部署和管理,目的是为了简化k8s结合Prometheus的配置、以及存储监控数据。


3. kube-state-metrics 是一个监控服务,收集k8s集群内所有资源的数据
https://github.com/kubernetes/kube-state-metrics


4.node_exporter  收集集群中Node节点资源的服务,不建议容器化部署,因为要直接访问宿主机的资源。若容器化部署,需要挂载宿主机的根文件系统。
https://github.com/prometheus/node_exporter


5. prometheus 主程序,是监控系统,可以监控k8s的如apiserver、scheduler、controller-manager、kubelet等组件数据

https://github.com/prometheus/prometheus

6.alertmanager
报警管理器,实现监控报警

https://github.com/prometheus/alertmanager

7.使用grafana实现数据可视化,获取普罗米修斯的监控数据指标,对数据可视化图标展示。
https://github.com/grafana/grafana
3.安装Prometheus
若是docker安装,直接
docker run --name prometheus -d -p 127.0.0.1:9090:9090 prom/prometheus:v2.28.0
可以基于该镜像,获取Prometheus的启动脚本,以及yml资源文件,进行k8s化部署。


1. 找到容器内的主配置文件,原生官网的配置文件,最为精准,咱们可以进行获取,修改。


[root@k8s-master-10 ~]#docker exec -it prometheus sh
/prometheus $ ps -ef
PID   USER     TIME  COMMAND
    1 nobody    0:00 /bin/prometheus --config.file=/etc/prometheus/prometheus.yml --storage.tsdb.path=/prometheus --web.console.libraries=/usr/share/prometheus/cons
   24 nobody    0:00 sh
   29 nobody    0:00 ps -ef


# 配置文件  --config.file=/etc/prometheus/prometheus.yml
# 数据存储目录  --storage.tsdb.path=/prometheus
====================================================================
# 原生配置文件如下

/prometheus $ cat /etc/prometheus/prometheus.yml
# my global config
global:
  scrape_interval:     15s # Set the scrape interval to every 15 seconds. Default is every 1 minute.
  evaluation_interval: 15s # Evaluate rules every 15 seconds. The default is every 1 minute.
  # scrape_timeout is set to the global default (10s).

# Alertmanager configuration
alerting:
  alertmanagers:
  - static_configs:
    - targets:
      # - alertmanager:9093

# Load rules once and periodically evaluate them according to the global 'evaluation_interval'.
rule_files:
  # - "first_rules.yml"
  # - "second_rules.yml"

# A scrape configuration containing exactly one endpoint to scrape:
# Here it's Prometheus itself.
scrape_configs:
  # The job name is added as a label `job=<job_name>` to any timeseries scraped from this config.
  - job_name: 'prometheus'

    # metrics_path defaults to '/metrics'
    # scheme defaults to 'http'.

    static_configs:
    - targets: ['localhost:9090']
/prometheus $
/prometheus $
转为k8s启动
1.配置文件
# my global config
global:
  scrape_interval:     15s # Set the scrape interval to every 15 seconds. Default is every 1 minute.
  evaluation_interval: 15s # Evaluate rules every 15 seconds. The default is every 1 minute.
  # scrape_timeout is set to the global default (10s).

# Alertmanager configuration
alerting:
  alertmanagers:
  - static_configs:
    - targets:
      # - alertmanager:9093

# Load rules once and periodically evaluate them according to the global 'evaluation_interval'.
rule_files:
  # - "first_rules.yml"
  # - "second_rules.yml"

# A scrape configuration containing exactly one endpoint to scrape:
# Here it's Prometheus itself.
scrape_configs:
  # The job name is added as a label `job=<job_name>` to any timeseries scraped from this config.
  - job_name: 'prometheus'

    # metrics_path defaults to '/metrics'
    # scheme defaults to 'http'.

    static_configs:
    - targets: ['localhost:9090']
2.放入configmap
[root@k8s-master-10 /all-k8s-yml/prometheus]#kubectl create ns monitor
namespace/monitor created


[root@k8s-master-10 /all-k8s-yml/prometheus]#kubectl -n monitor create configmap prometheus-config --from-file=prometheus.yml
configmap/prometheus-config created
3.创建pv、pvc
apiVersion: v1
kind: PersistentVolume
metadata:
  name: prometheus-local
  labels:
    app: prometheus
spec:
  accessModes:
  - ReadWriteOnce
  capacity:
    storage: 10Gi
  storageClassName: local-storage
  local:
    path: /data/k8s/prometheus
  nodeAffinity:
    required:
      nodeSelectorTerms:
      - matchExpressions:
        - key: kubernetes.io/hostname
          operator: In
          values:
          - k8s-node-12
  persistentVolumeReclaimPolicy: Retain
---
apiVersion: v1
kind: PersistentVolumeClaim
metadata:
  name: prometheus
  namespace: monitor
spec:
  selector:
    matchLabels:
      app: prometheus
  accessModes:
  - ReadWriteOnce
  resources:
    requests:
      storage: 10Gi
  storageClassName: local-storage
创建pvc,提供存储普罗米修斯抓取的数据
4.Deployment部署prometheus
apiVersion: apps/v1
kind: Deployment
metadata:
  name: prometheus
  namespace: monitor
  labels:
    app: prometheus
spec:
  selector:
    matchLabels:
      app: prometheus
  template:
    metadata:
      labels:
        app: prometheus
    spec:
      serviceAccountName: prometheus
      initContainers:
      - name: "change-permission-of-directory"
        image: busybox
        command: ["/bin/sh"]
        args: ["-c", "chown -R 65534:65534 /prometheus"]
        securityContext:
          privileged: true
        volumeMounts:
        - mountPath: "/etc/prometheus"
          name: config-volume
        - mountPath: "/prometheus"
          name: data
      containers:
      - image: prom/prometheus:v2.28.0
        name: prometheus
        args:
        - "--config.file=/etc/prometheus/prometheus.yml" # 配置文件
        - "--storage.tsdb.path=/prometheus"  # 指定tsdb数据路径
        - "--web.enable-lifecycle"  # 支持热更新,直接执行localhost:9090/-/reload立即生效
        - "--web.console.libraries=/usr/share/prometheus/console_libraries"
        - "--web.console.templates=/usr/share/prometheus/consoles"
        ports:
        - containerPort: 9090
          name: http
        volumeMounts:
        - mountPath: "/etc/prometheus"
          name: config-volume
        - mountPath: "/prometheus"
          name: data
        resources:
          requests:
            cpu: 100m
            memory: 512Mi
          limits:
            cpu: 100m
            memory: 512Mi
      volumes:
      - name: data
        persistentVolumeClaim:
          claimName: prometheus
      - configMap:
          name: prometheus-config
        name: config-volume
5.rbac
apiVersion: v1
kind: ServiceAccount
metadata:
  name: prometheus
  namespace: monitor
---
apiVersion: rbac.authorization.k8s.io/v1
kind: ClusterRole
metadata:
  name: prometheus
rules:
- apiGroups:
  - ""
  resources:
  - nodes
  - services
  - endpoints
  - pods
  - nodes/proxy
  verbs:
  - get
  - list
  - watch
- apiGroups:
  - "extensions"
  resources:
    - ingresses
  verbs:
  - get
  - list
  - watch
- apiGroups:
  - ""
  resources:
  - configmaps
  - nodes/metrics
  verbs:
  - get
- nonResourceURLs:
  - /metrics
  verbs:
  - get
---
apiVersion: rbac.authorization.k8s.io/v1beta1
kind: ClusterRoleBinding
metadata:
  name: prometheus
roleRef:
  apiGroup: rbac.authorization.k8s.io
  kind: ClusterRole
  name: prometheus
subjects:
- kind: ServiceAccount
  name: prometheus
  namespace: monitor
6.svc
piVersion: v1
kind: Service
metadata:
  name: prometheus
  namespace: monitor
  labels:
    app: prometheus
spec:
  selector:
    app: prometheus
  type: ClusterIP
  ports:
    - name: web
      port: 9090
      targetPort: http
7.ingress
apiVersion: networking.k8s.io/v1
kind: Ingress
metadata:
  name: prometheus
  namespace: monitor
spec:
  rules:
  - host: prometheus.yuchaoit.com
    http:
      paths:
      - path: /
        pathType: Prefix
        backend:
          service:
            name: prometheus
            port:
              number: 9090
应用所有资源
# 创建pvc所需的目录
[root@k8s-node-12 ~]#mkdir -p /data/k8s/prometheus

# 命名空间
$ kubectl create namespace monitor

# 配置文件
$ kubectl -n monitor create configmap prometheus-config --from-file=prometheus.yml

#部署configmap
$ kubectl apply -f .

# 访问测试
$ kubectl -n monitor get ingress


[root@k8s-master-10 /all-k8s-yml/prometheus]#kubectl -n monitor get all -owide
NAME                              READY   STATUS    RESTARTS   AGE    IP           NODE          NOMINATED NODE   READINESS GATES
pod/prometheus-7d6799c84c-n8pkb   1/1     Running   0          2m2s   10.2.2.100   k8s-node-12   <none>           <none>

NAME                 TYPE        CLUSTER-IP    EXTERNAL-IP   PORT(S)    AGE    SELECTOR
service/prometheus   ClusterIP   10.1.87.167   <none>        9090/TCP   2m3s   app=prometheus

NAME                         READY   UP-TO-DATE   AVAILABLE   AGE    CONTAINERS   IMAGES                    SELECTOR
deployment.apps/prometheus   1/1     1            1           2m3s   prometheus   prom/prometheus:v2.28.0   app=prometheus

NAME                                    DESIRED   CURRENT   READY   AGE    CONTAINERS   IMAGES                    SELECTOR
replicaset.apps/prometheus-7d6799c84c   1         1         1       2m3s   prometheus   prom/prometheus:v2.28.0   app=prometheus,pod-template-hash=7d6799c84c
[root@k8s-master-10 /all-k8s-yml/prometheus]#
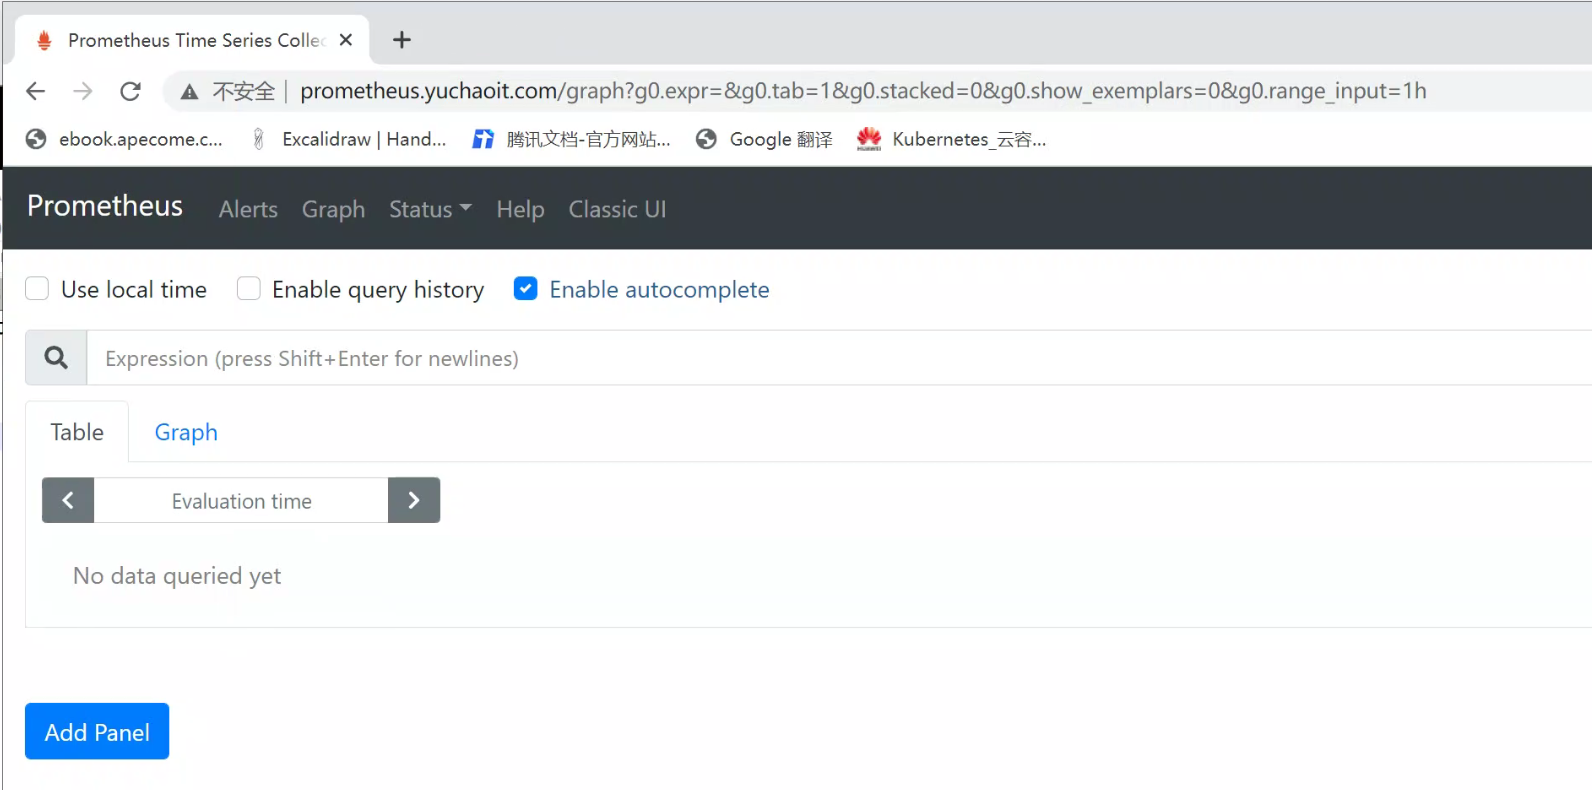
访问普罗米修斯
添加域名解析
10.0.0.10 prometheus.yuchaoit.com